
RE:Dox Repository · REDox.Unreal
UE5 + RE:Dox
Unreal Engine X connects Unreal Insights to RE:Dox, CAPCOM's token-based structured-data engine for .NET. Insights analyses a trace as usual and streams the result to REDox.Unreal, a .NET 10 command-line tool in the RE:Dox repository. The tool writes a compact capture and a Markdown summary sized for an LLM.
Raw trace data is far too large for a model: an early per-scope JSON export of a 144 MB .utrace was 8 GB. A session summary is about 20k tokens, and its numbers match stock Insights exactly.
Output
Each session writes two files to the output folder:
REDox-<timestamp>-<session>.ndjson      capture archive
REDox-<timestamp>-<session>.summary.md  LLM summary
The summary contains:
- frame percentiles per phase (phases split at loads and mode switches),
- CPU timer statistics per thread group and GPU busy time per queue,
- the worst hitches, with scope trees for the game, render and RHI threads,
- PSO precache misses, with the material and pass that requested them,
- log warnings and errors, bookmarks and render-graph summaries.
The .utrace is not changed and stays the lossless archive.
Setup
-
Build Unreal Insights from the fork with
XDevops/XRebuildUnrealInsights.bat. -
Build
REDox.Unrealfrom the RE:Dox repository:dotnet build tools/REDox.Unreal/REDox.Unreal.csproj -
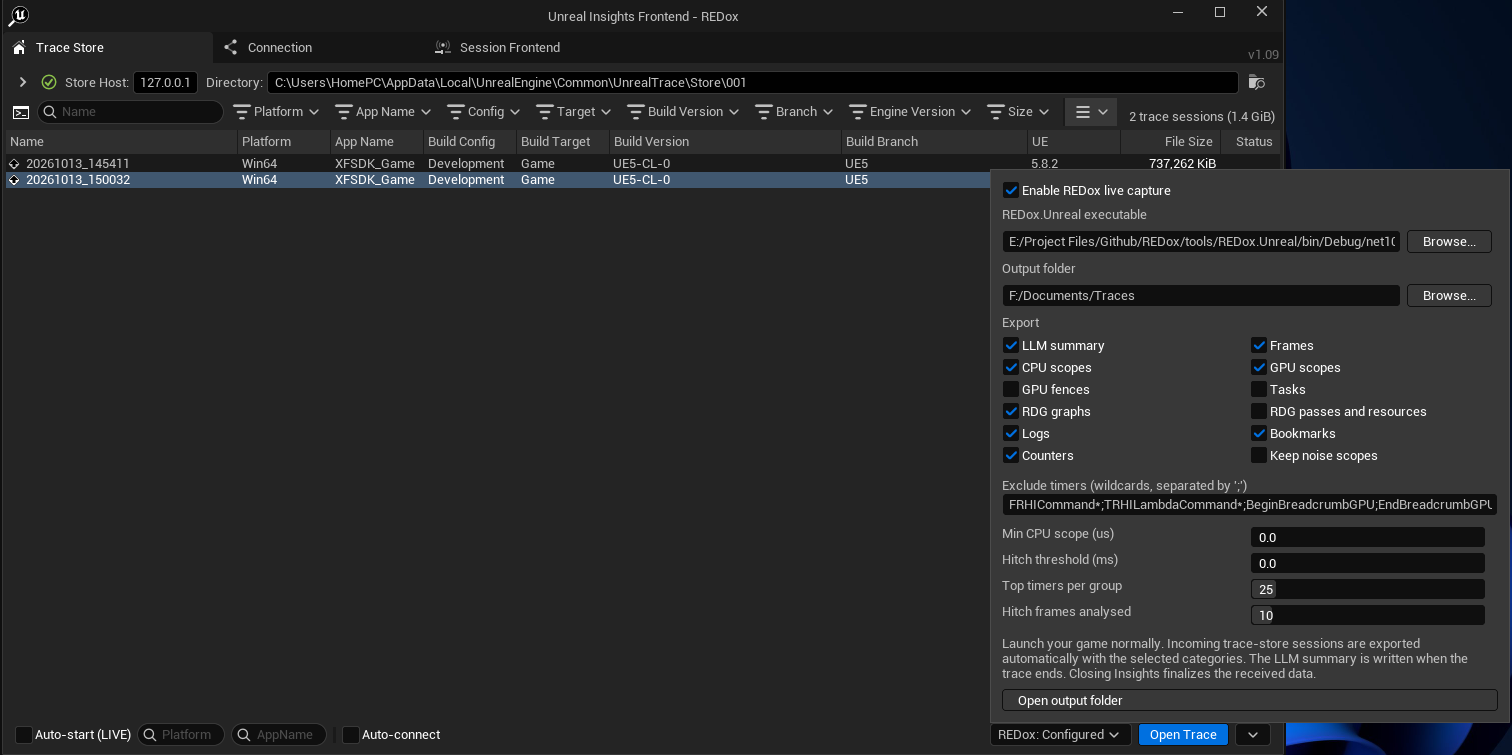
In Insights, open the REDox dropdown beside Open Trace. Choose
REDox.Unreal.exe, an output folder and the categories to export, then enable REDox. Settings are saved inUnrealInsightsFrontendSettings.ini, section[Insights.REDox].
Rebuild Insights and REDox.Unreal together. The receiver rejects other protocol versions.
Capturing
Launch the game with tracing to the local trace server:
MyGame.exe -trace=cpu,gpu,frame,rdg,log,bookmark -tracehost=127.0.0.1
Insights starts a background analysis for each live session. Its status goes Starting → Ready → Live → Draining → Complete, and the summary is written when the trace ends. If Insights is closed early, the capture is kept but no summary is written.
Enable the log and bookmark channels. Bookmarks mark where settings changed (for example a TRACE_BOOKMARK on every console-variable change), which is how A/B segments are found later. Leave rhicommands and rendercommands off: they are excluded as noise but still cost analysis time.
Export categories
| Category | Default | Contents |
|---|---|---|
| LLM summary | on | Phases, frame percentiles, CPU and GPU tables, hitches, typical frames, PSO precache results |
| Frames | on | Every game and rendering frame interval |
| CPU scopes / GPU scopes | on | Raw scopes in columnar batches, for drill-down reports |
| RDG graphs | on | One summary per render graph: passes, textures, buffers, transient memory |
| Logs, Bookmarks, Counters | on | When the matching trace channels are enabled |
| GPU fences, Tasks, RDG passes and resources | off | Large; enable when needed |
Command line
Export an existing trace without the UI:
UnrealInsights.exe -OpenTraceFile="D:/Captures/session.utrace" -NoUI -AutoQuit -Redox -RedoxExe="<REDox>/tools/REDox.Unreal/bin/Debug/net10.0/REDox.Unreal.exe" -RedoxOutput="D:/Diagnostics" -RedoxExports="Summary,Frames,Logs"
| Command | Use |
|---|---|
summarize <capture.ndjson> | Render the summary from a finished capture |
report <capture.ndjson> --frame <index> | JSON drill-down of one frame, or of a time window with --from / --to |
ingest-log <Game.log> | Convert a text log; summarize then groups its warnings and errors |
ingest-insights <TimingEvents.csv> | Import a stock Insights timing-event CSV |
Reading the summary
Give the model the .summary.md first, then use report on the frames it points to.
- Inclusive times contain their children, and parallel threads overlap: never add nested durations.
- GPU numbers are busy time per queue, not breadcrumb spans.
- A missing section means the channel was not traced, not that no work happened.
Engine changes
| Module | Files |
|---|---|
| TraceInsights | Insights/Redox/RedoxSessionExporter.h/.cpp, Public/Insights/Redox/IRedoxRenderGraphProvider.h, InsightsManager.h/.cpp |
| TraceInsightsFrontend | InsightsFrontendSettings.h, STraceStoreWindow.h/.cpp, SConnectionWindow.cpp, TraceInsightsFrontendModule.cpp |
| RenderGraphInsights | Render-graph provider and trace module, plus a Json dependency |